65%
2nd
3+
Overview
I led end-to-end design of ALTR's data observability dashboard, taking an 8-week MVP from discovery to launch by building on existing data infrastructure with zero new pipelines. The feature grew 4x in adoption within 3 months and became the second most-visited page in the product, establishing observability as a core strategic pillar at ALTR.
ALTR was already collecting rich log data but in it's raw state, visibility into trends and anomalies was difficult. With product management and engineering collaboration, I helped drive product direction to ship a solution that gave customers powerful insight to who was accessed what data, and when.
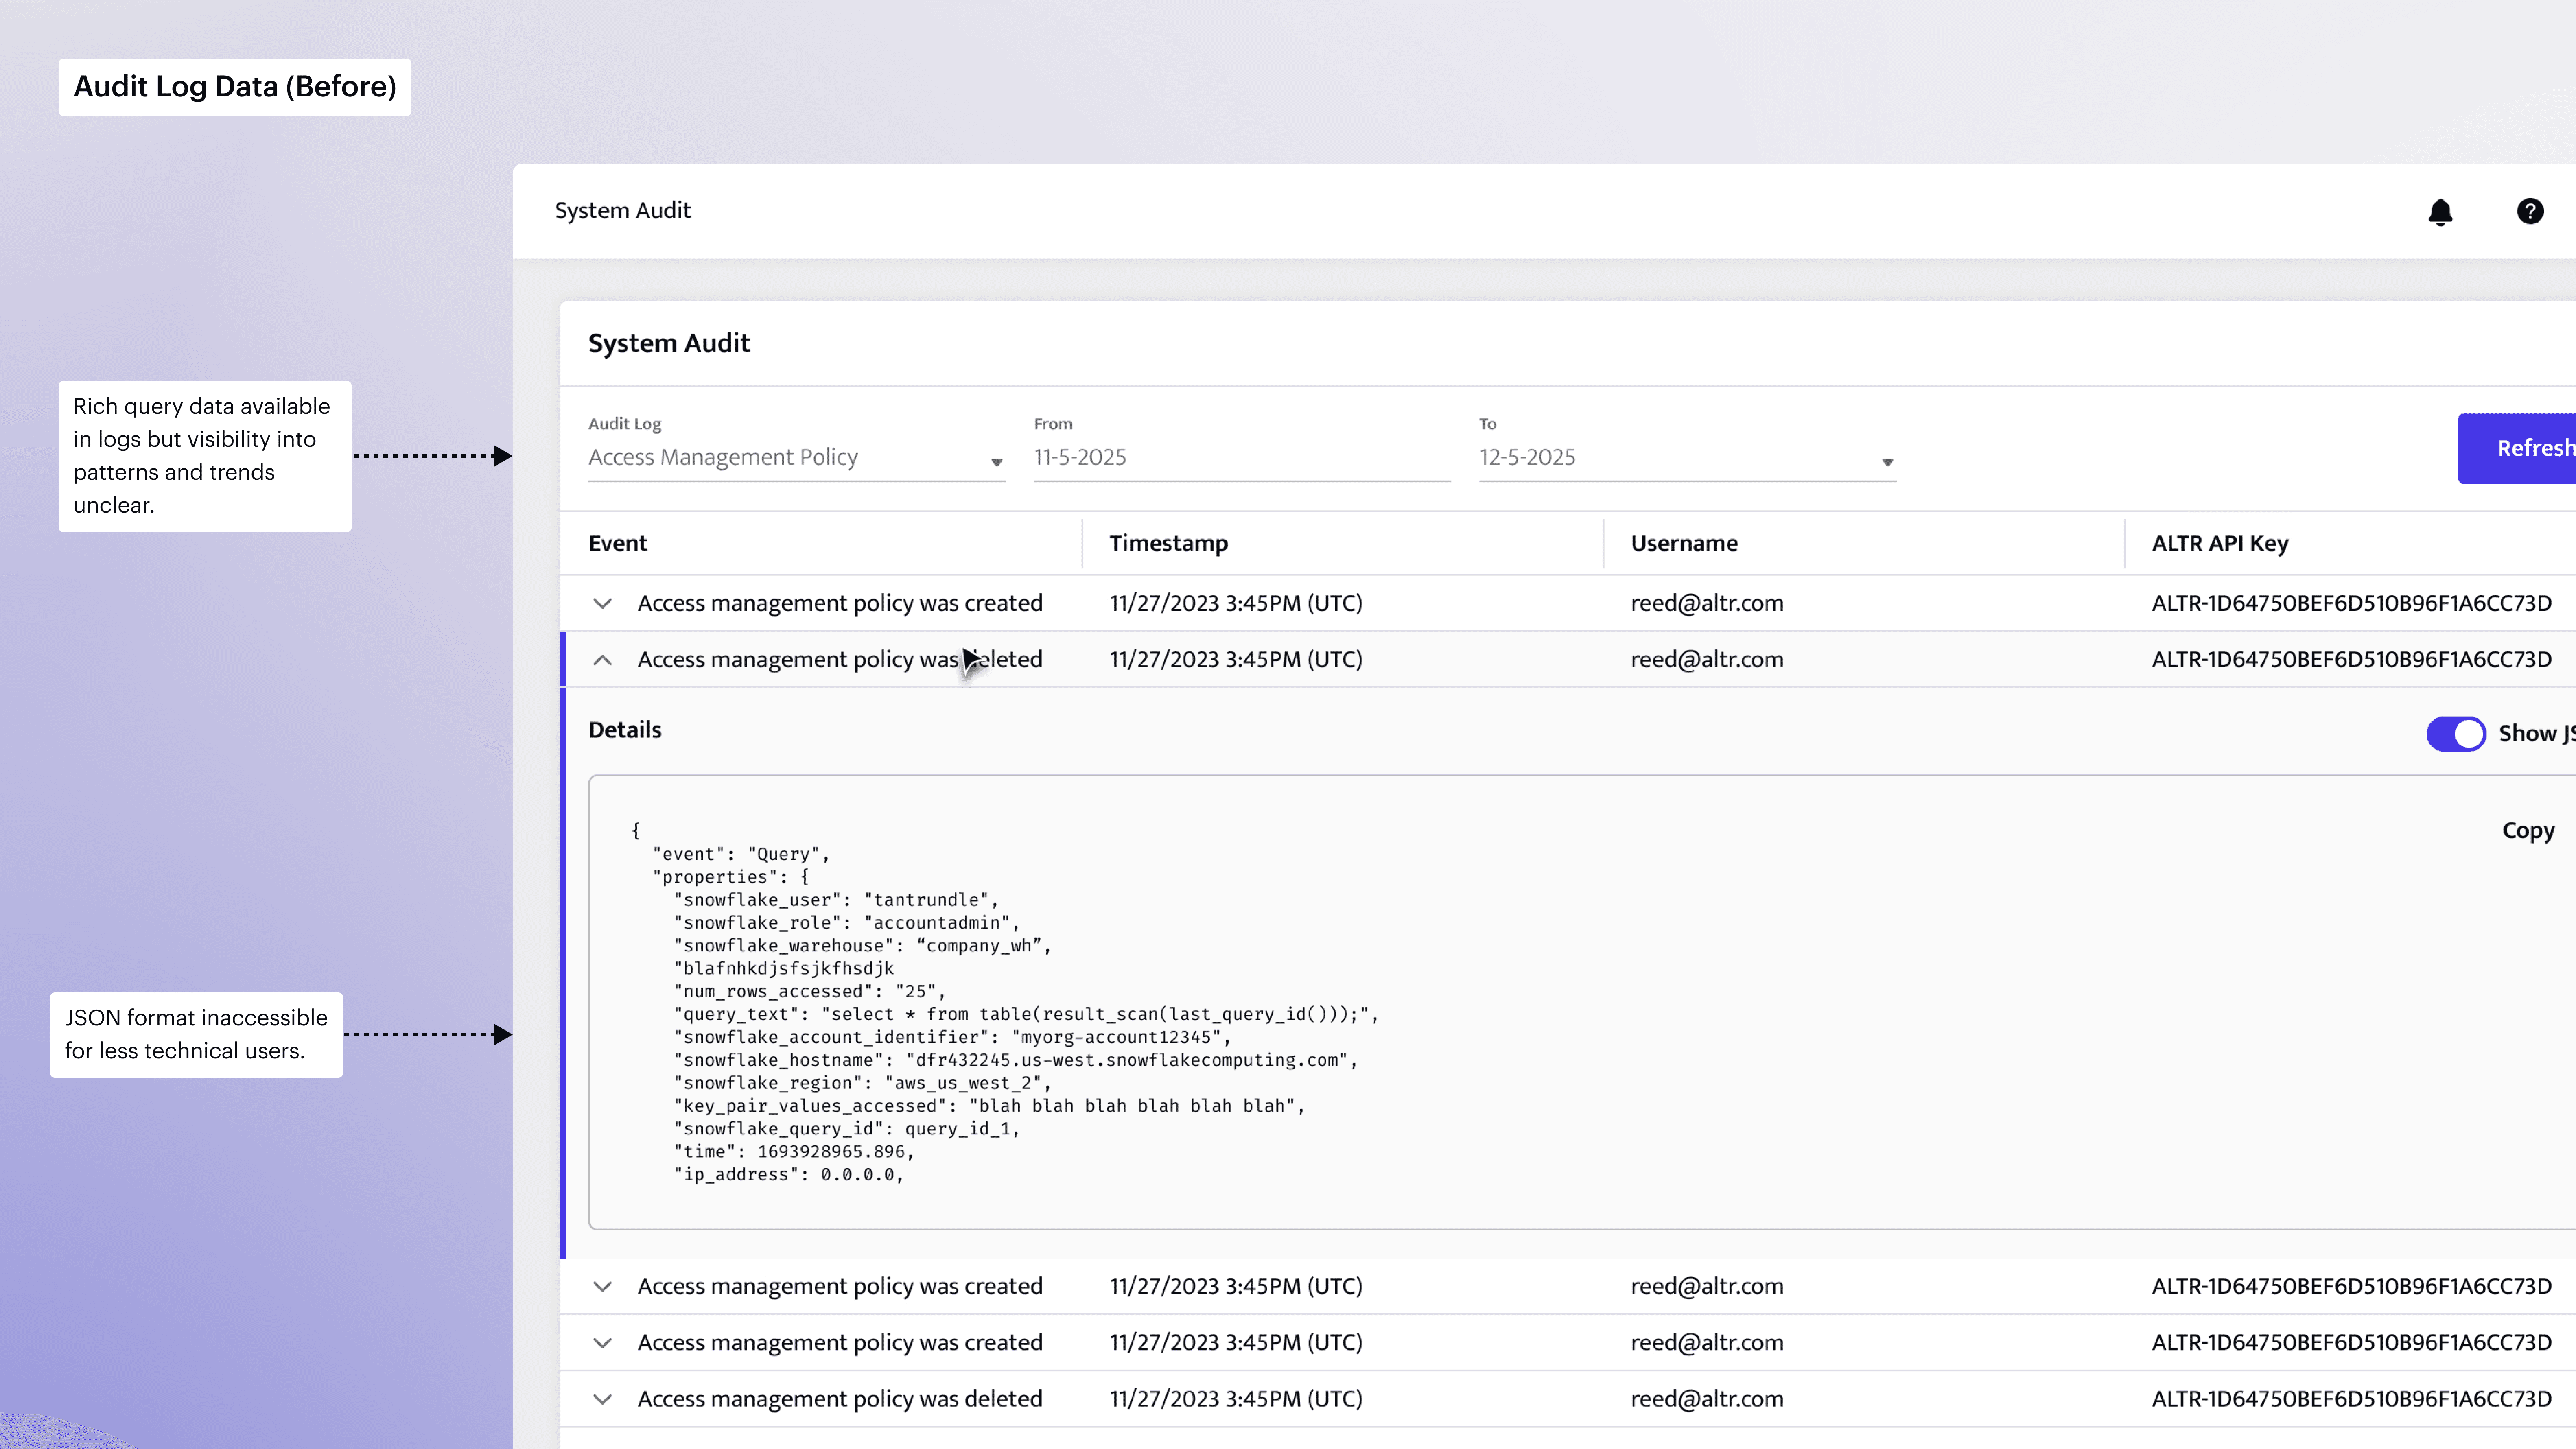
Building from Existing Infrastructure
The tightest constraint on this project became its clearest design principle: build maximum value from existing data infrastructure. Early in the process I worked with engineering to map our existing log data to visualization opportunities before any UI work began. I then story-mapped customer workflows to identify the highest-impact use cases and prioritized features our existing data structure could support at launch.


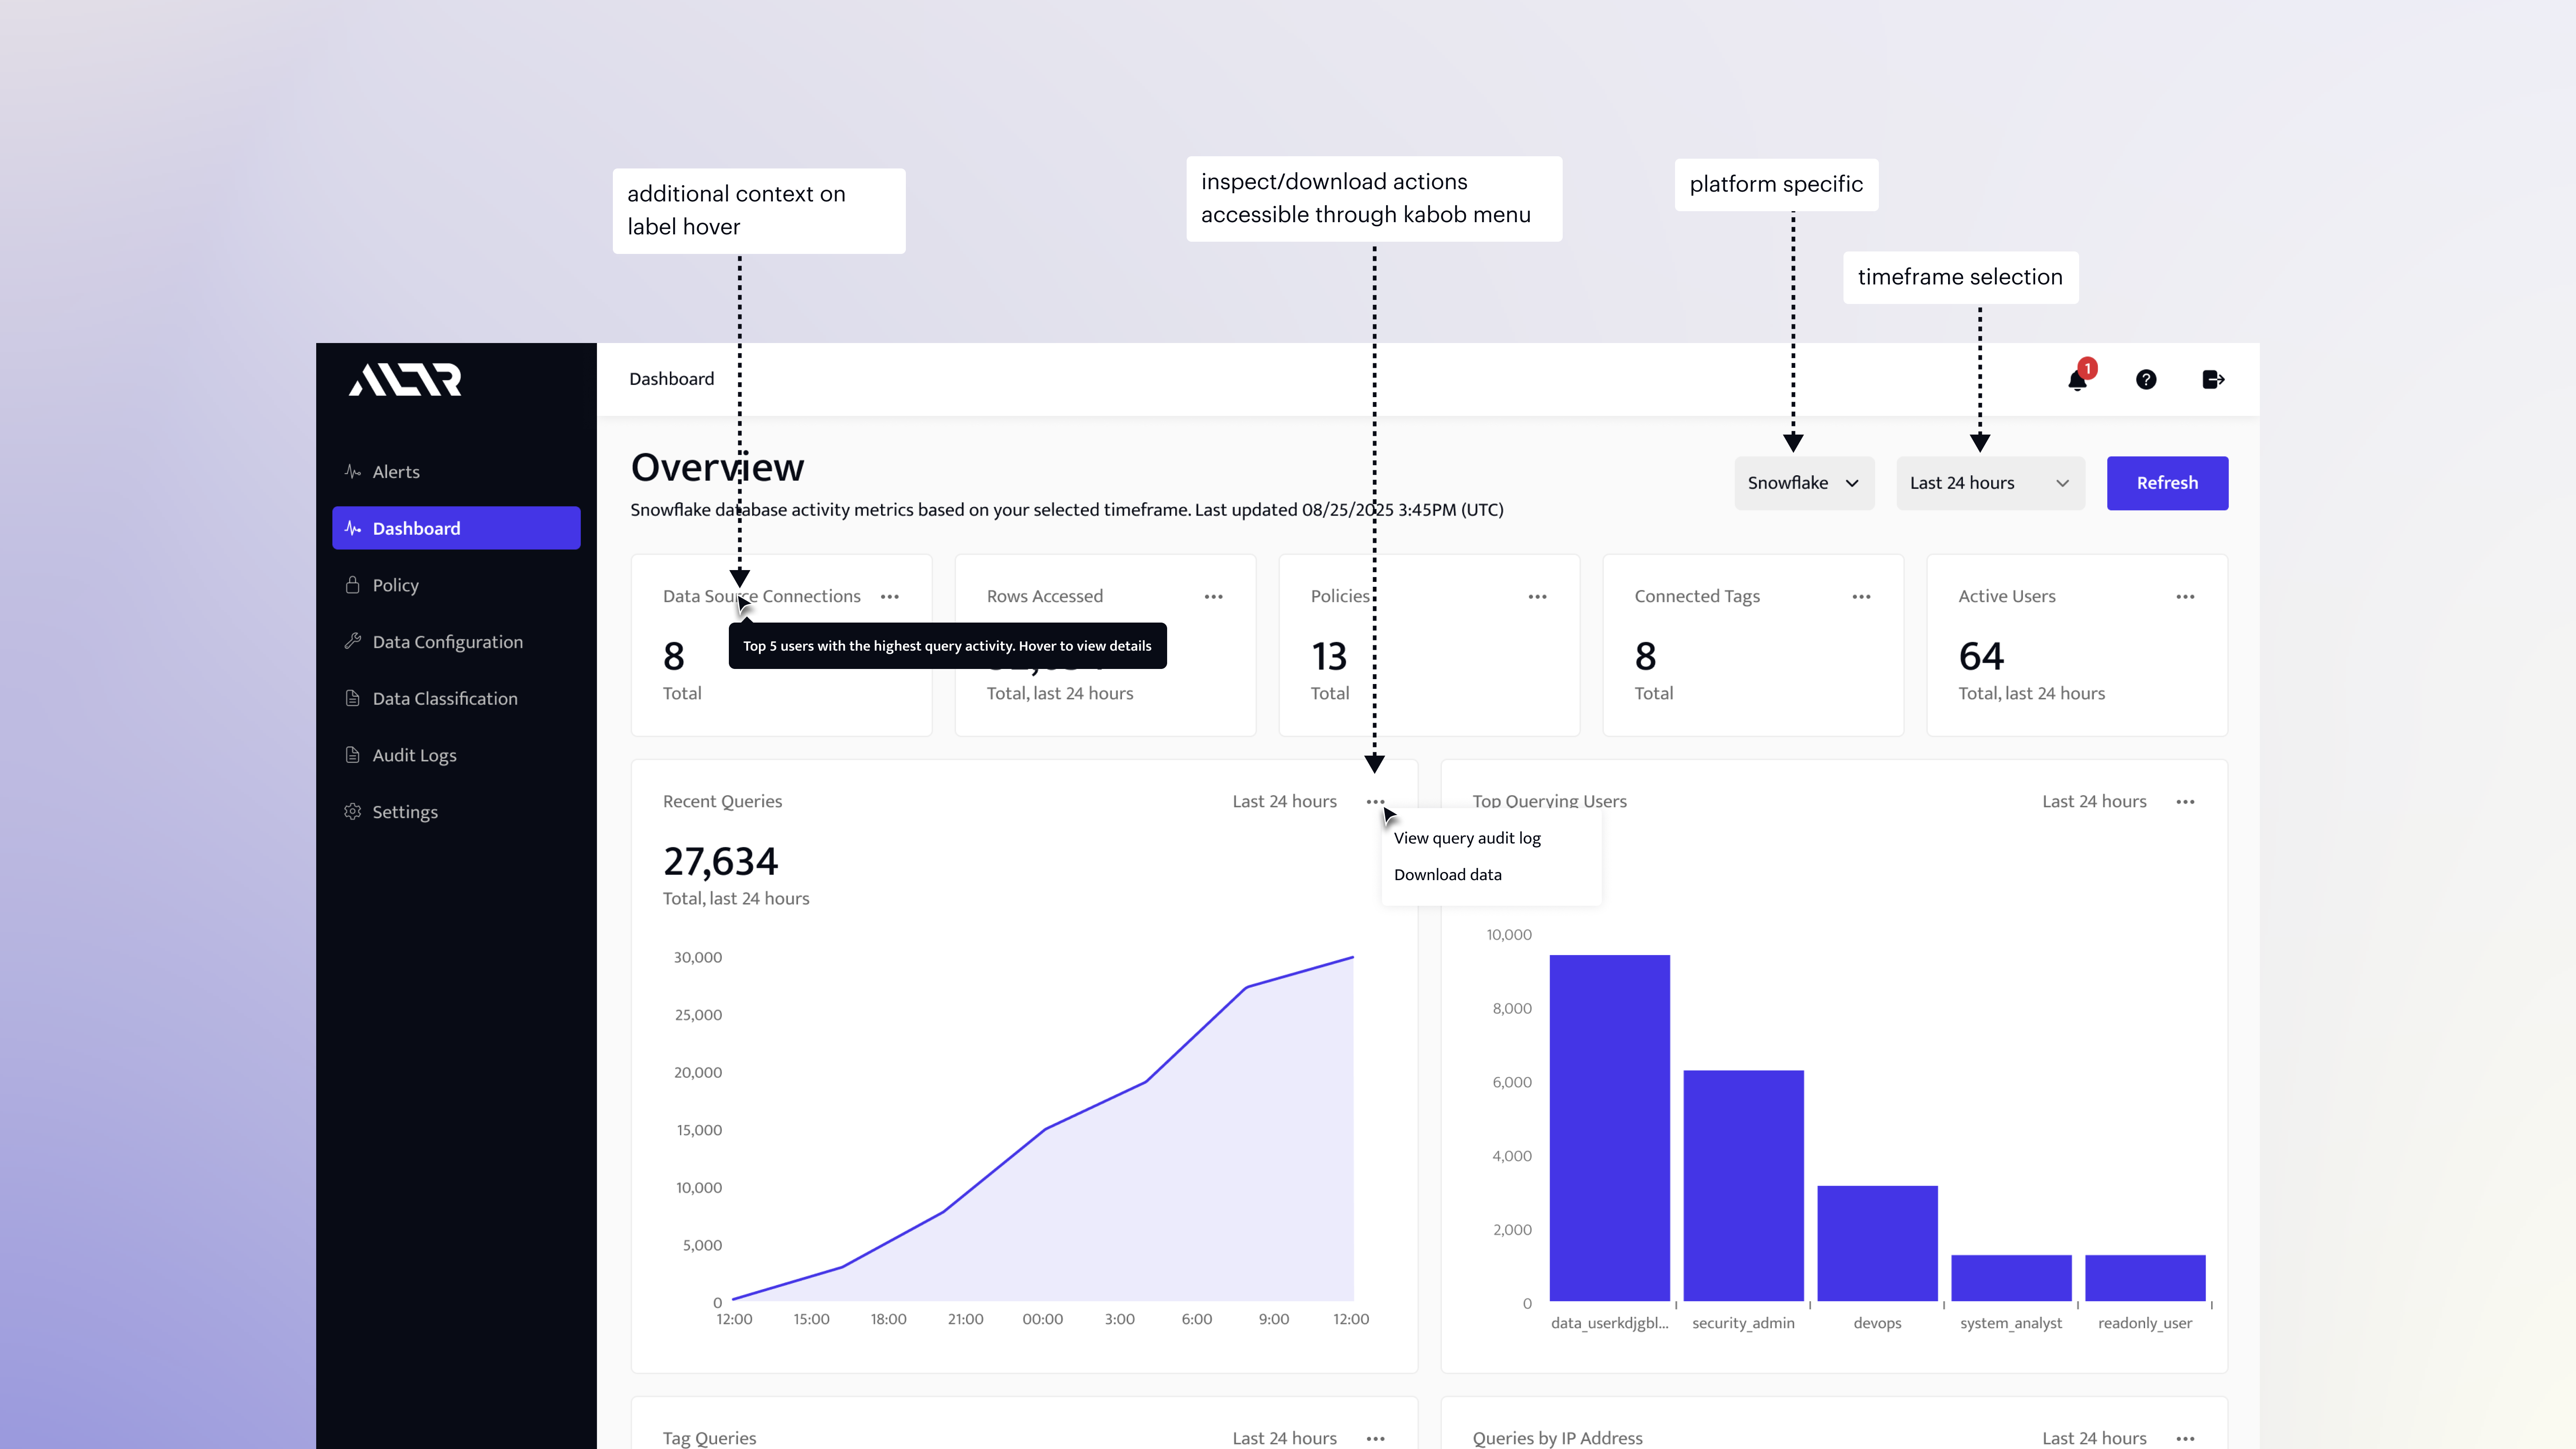
A Key Design Decision: Progressive Disclosure
A central UX challenge was building for breadth and depth. Users needed a fast, scannable overview and the ability to investigate deeply without losing context. A key design decision was a "pages within widgets" pattern. Default visualizations showed trend data across a 7-day window, clicking into any data point opened a detail view with granular event-level information. This served two distinct audiences within one coherent interface: compliance and security stakeholders who needed a daily pulse, and data and engineering teams who needed depth for incident investigation.
Launch & Impact
Two weeks after launch I conducted three customer interviews to validate our approach. Customers were seeing value immediately, describing the dashboard as a bridge between technical and non-technical stakeholders. Dense log data now had a shape non-engineers could read and act on. The interviews also surfaced clear gaps. All three customers wanted a 24-hour view to compare daily activity across environments, and all three wanted clearer paths to act on the anomalies they were now able to see. That feedback drove two outcomes: a 24-hour view shipped within 30 days of those interviews, and a prioritized set of observability and alerting features that anchored our 2026 roadmap.

Within 3 months of launch, the dashboard reached 65% of ALTR's active customer base and became the second most-visited page in the product. Customers were coming back regularly, building it into how they monitor their data environments day to day. Customers could now identify abnormal access patterns faster, demonstrate compliance with data access requirements, and make proactive security decisions. What started as an 8-week MVP became a strategic product pillar and the foundation for executive investment in expanding ALTR's observability capabilities through 2026.